
Enabling the MongoDB Logging Firehose

Background
With the recent publicizing of the MongoBleed vulnerability (CVE-2025-14847), many security organizations will inevitably be scrambling to understand what log visibility is available to them to detect and respond to MongoDB related security incidents.
Historically speaking, MongoDB logging has been a bit of a double-edged sword. On the one hand, it is possible to turn on very verbose debug logging to enable visibility of some of these interesting events. On the other hand, in production systems, these logs can be quite voluminous. Performance implications can be created if too much debug logging is enabled on high throughput systems, so understanding what is available and what is required to satisfy your visibility requirements is paramount.
The good news is that if you are using the Abstract platform as a security data pipeline, MongoDB logs can be quickly and easily aggregated to greatly lower the total cost for signaling effectively on this important log source.
While we’ll reference Abstract where it’s illustrative, this post is not a walkthrough of platform features. The goal is to give security teams a clear mental model for MongoDB logging, attack-driven log volume, and how to reason about signal versus noise in any environment.
Technical Details
In our testing, a single vulnerable MongoDB server being attacked with Joe Desimone’s MongoBleed tool (https://github.com/joe-desimone/mongobleed?tab=readme-ov-file) would generate 16,604 log entries, with the following logging enabled:
--setParameter “logComponentVerbosity={network: 0, command: 1, accessControl: 0, query: 0}” --quiet
Due to the nature of the MongoBleed attack, there are tens of thousands of packets which are required to be sent back and forth to the MongoDB server to effectively scrape useful data out of memory. This can cause security teams huge headaches, because to effectively signal on the command debug data enabled by the logComponentVerbosity parameter, you must open the MongoDB log floodgates.
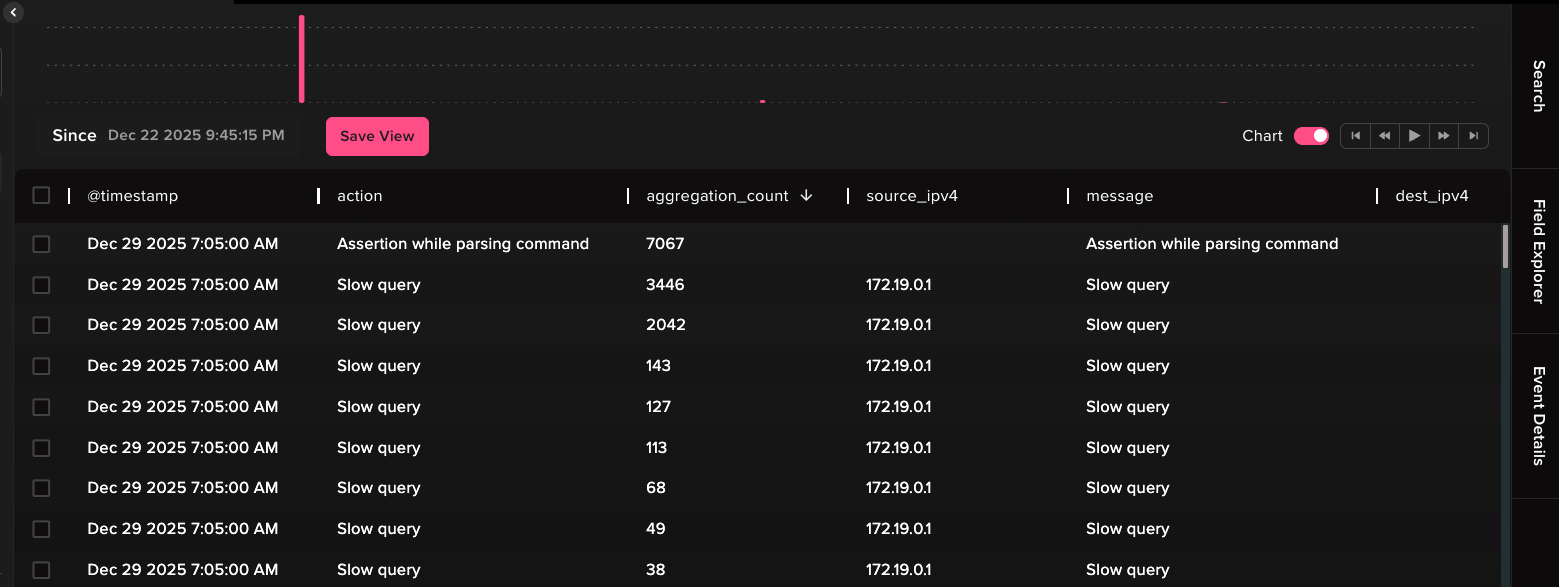
When we tested ingesting this data into the Abstract platform and enabling our default MongoDB aggregation with 0 tuning whatsoever, we were able to see an 85%+ decrease in MongoDB logs out-of-the-box.
16,604 logs were shrunk to 2,427 events, with some of the logs being aggregated as highly as 7067:1, using only a 1-minute aggregation window.
With further configuration and tuning, dropping log events which have little or no security value, it’s highly likely that some organizations will see > 90% reduction in logs, while still being able to effectively signal against the data.
Here is an example of a low value raw command error log which generated over 8k logs by running the default MongoBleed attack:{
"t": {
"$date": "2025-12-27T20:04:06.437+00:00"
},
"s": "D1",
"c": "COMMAND",
"id": 21963,
"ctx": "conn6",
"msg": "Assertion while parsing command",
"attr": {
"error": "InvalidBSON: BSON object not terminated with EOO in element with field name '?' in object with unknown _id"
}
}
These logs aren’t really that useful and can be dropped entirely without losing security visibility. There is no source IP address, and the truly valuable corresponding connection log—which has the actual valuable information—contains additional data like the source IP address and other details regarding the query:
{
"t": {
"$date": "2025-12-27T20:04:06.437+00:00"
},
"s": "I",
"c": "COMMAND",
"id": 51803,
"ctx": "conn6",
"msg": "Slow query",
"attr": {
"type": "none",
"isFromUserConnection": true,
"ns": "",
"collectionType": "none",
"numYields": 0,
"ok": 0,
"errMsg": "BSON object not terminated with EOO in element with field name '?' in object with unknown _id",
"errName": "InvalidBSON",
"errCode": 22,
"reslen": 180,
"locks": {},
"cpuNanos": 109443,
"remote": "172.19.0.1:60488",
"numInterruptChecks": 0,
"queues": {
"ingress": {},
"execution": {}
},
"workingMillis": 0,
"durationMillis": 0
}
}
Aggregating these “Slow query” events, while keeping useful information such as the source IP address, message and error message, provides tremendous signaling value without having to waste resources on processing low value log data.
Furthermore, this logging is not just useful for security logging. Monitoring for things like “Slow query” events within MongoDB can help tune your application or system to ensure your database is operating optimally and so is useful to SRE and security teams alike.
Recommendations
Databases within organizations will remain targets for attackers for the foreseeable future. These systems are often the source of truth within organizations, and as such should be treated as first class citizens when it comes to health monitoring, logging, threat detection, and incident response. Prioritizing the ingestion of these critical data sources remains at the forefront of the observability and DFIR space.
Conclusion
To successfully detect MongoDB systems being abused, both by MongoBleed and other attack vectors, some form of event firehose must be enabled. Some teams may only have the ability to enable network level logging and will need to deduce which systems trigger volumetric anomalies within their environment. Others will be able to use the native MongoDB logComponentVerbosity parameter to enable logs required to effectively defend their MongoDB instances.
In either case, simply turning on these massive feeds and logging everything will prove both costly, and resource intensive. Effectively managing your security data pipelines to greatly reduce the total amount of ingested data required to make an informed decision or assertion will help your security teams triage and respond to the latest threats effectively, both now and in the future.
We don’t know when the next huge vulnerability will become public and require onboarding new data sources so teams can effectively defend their estate. When it does happen, Abstract will be there to help our customers separate the signal from the noise, making the big picture clearer so your teams can act swiftly, safely and confidently.
ABSTRACTED
We would love you to be a part of the journey, lets grab a coffee, have a chat, and set up a demo!
Your friends at Abstract AKA one of the most fun teams in cyber ;)
.avif)
Your submission has been received.