See Your Splunk Data Reduction Potential — Before You Touch a Pipeline
Most Splunk environments contain over 90% data that's never read—data that's costing you money while burying the signals your analysts actually need.
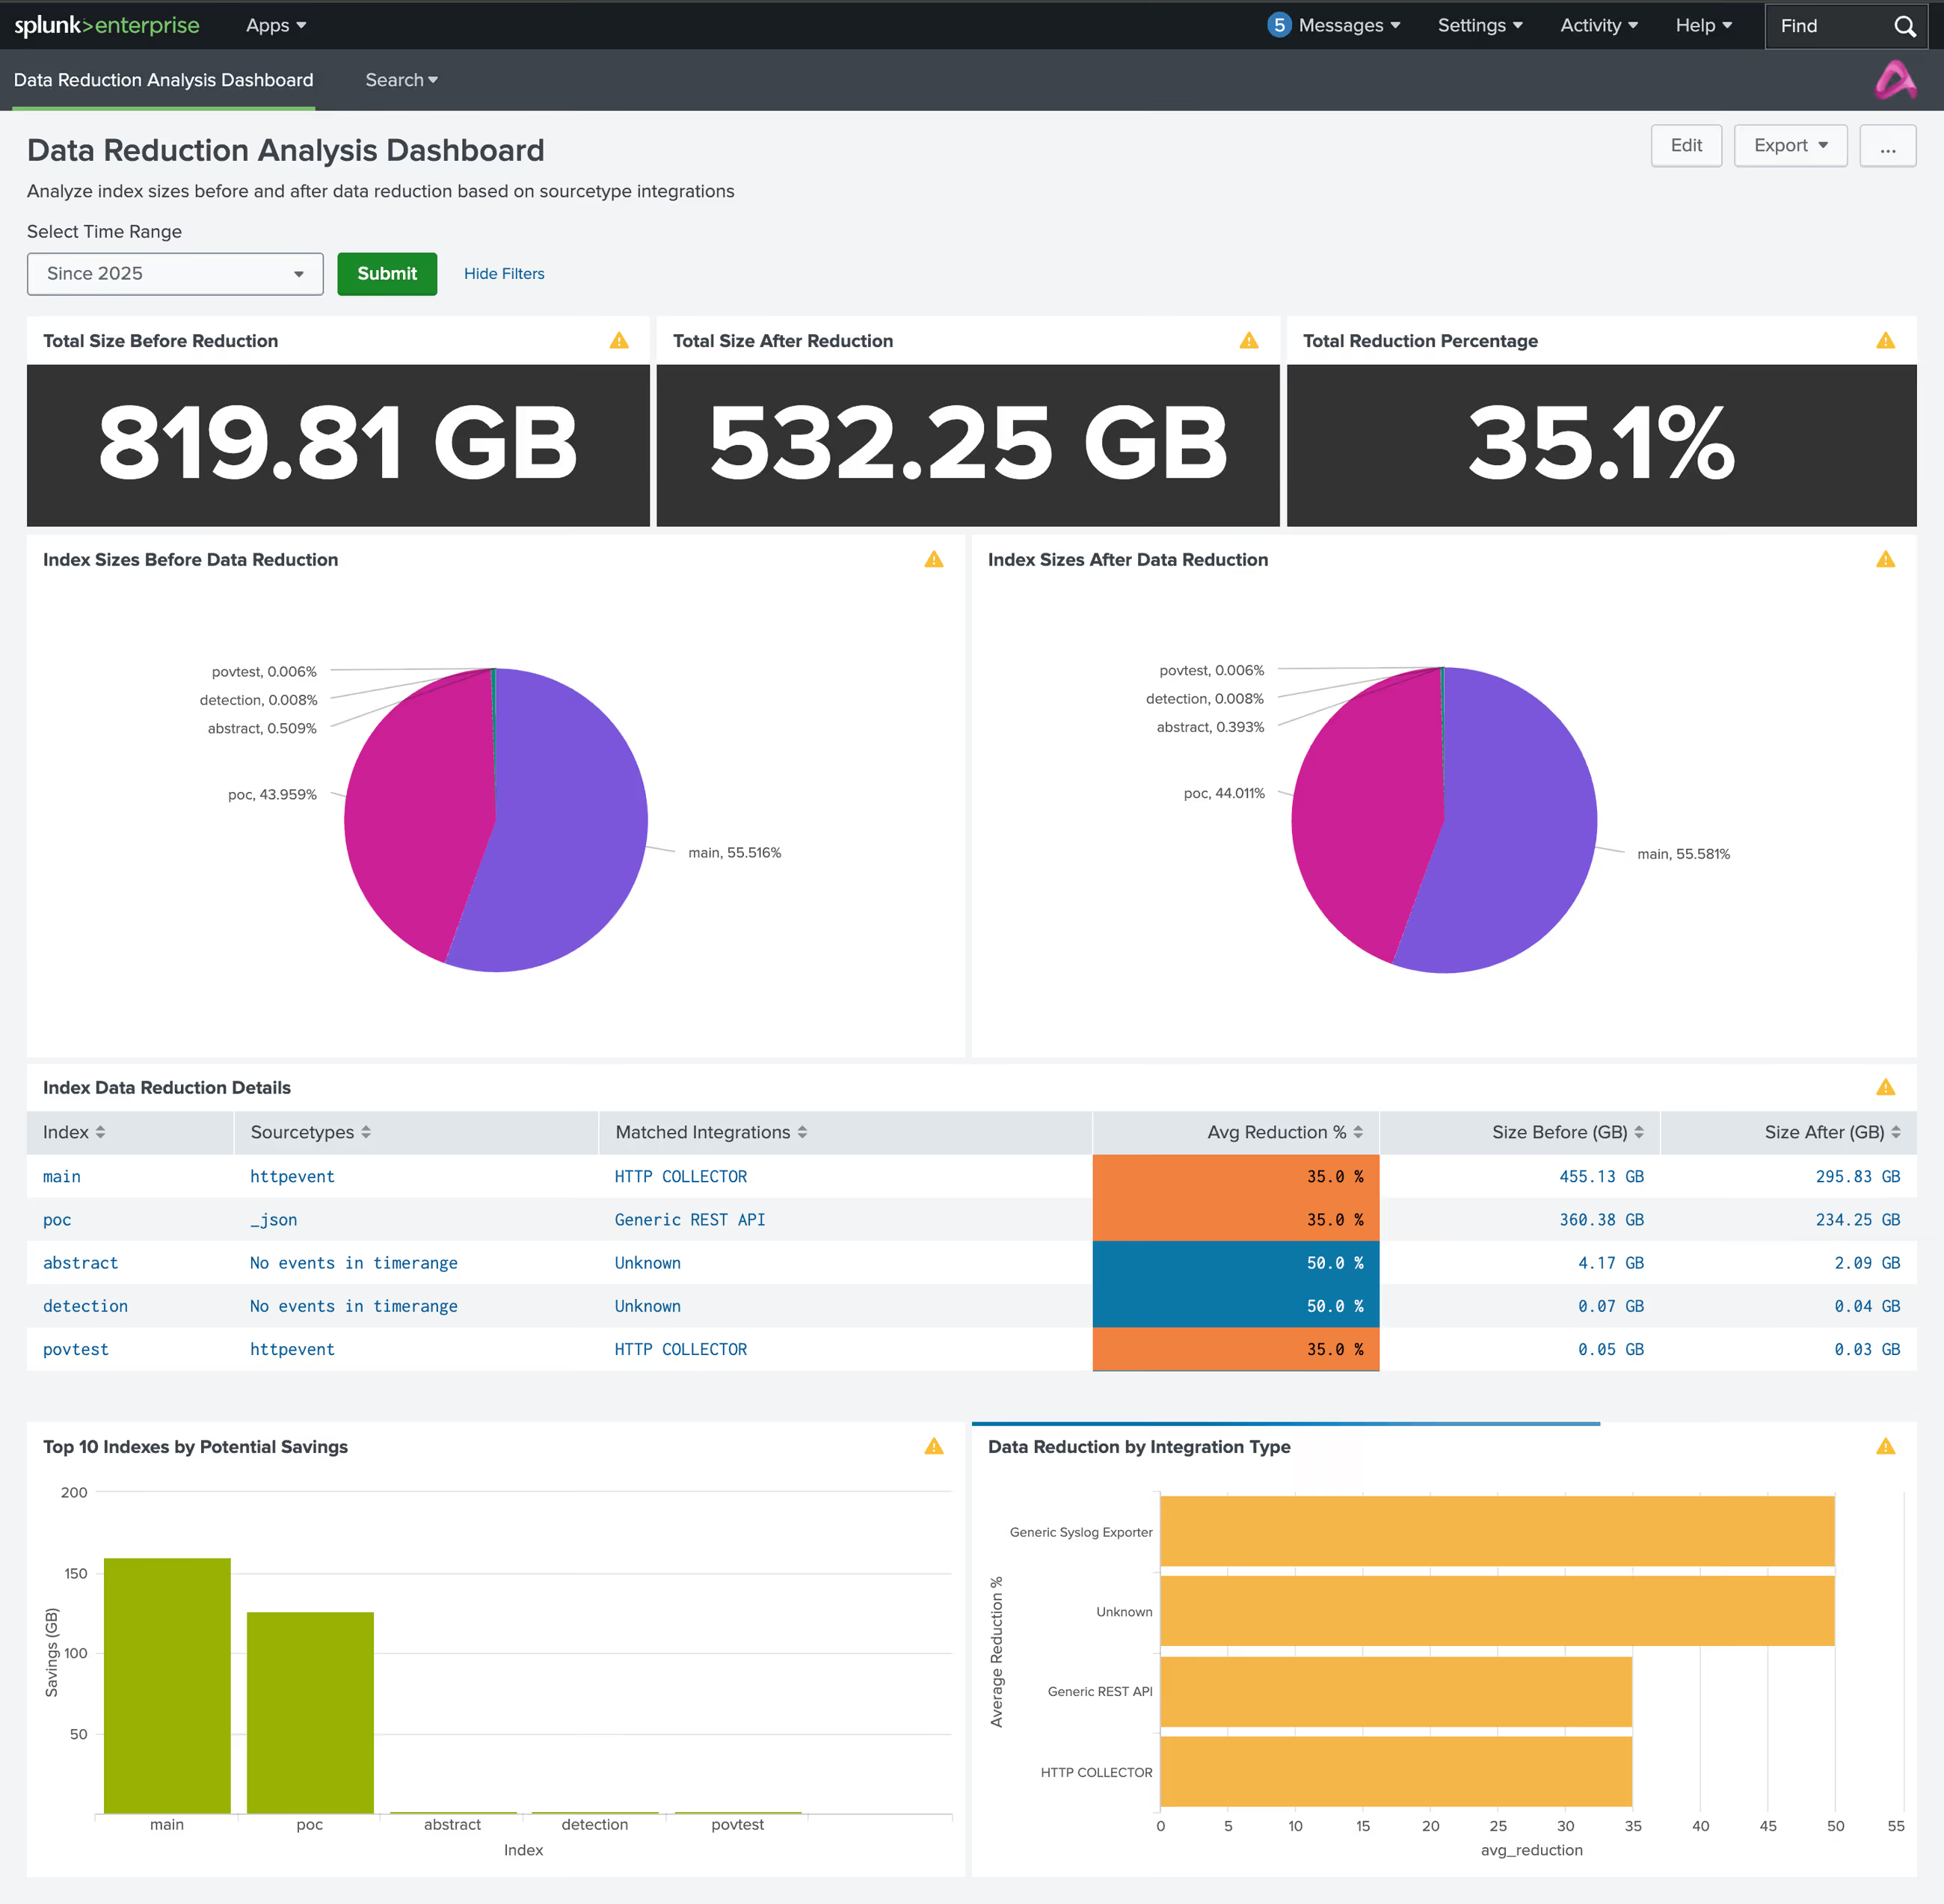
This free app analyzes your indexes and sourcetypes to show you what's driving your volume and where optimization opportunities exist.
It installs directly into your Splunk environment and shows you:
- Which data sources dominate your footprint – relative volume by index & sourcetype
- Where optimization opportunities exist – projected reduction potential by integration type
- Before and after projections – visualize the impact of potential changes
Every GB of unnecessary data isn't just inflating your bill—it's slowing investigations, hiding intrusions in baseline noise, and forcing your analysts to filter through events that may not matter.
This app gives you a head start to making informed decisions about your data footprint.