
C2 Corner: State of Enterprise Detection Engineering for a Modern SOC
Executive Summary
Detection engineering is a lifecycle. The mission is simple, reduce risk and catch attackers earlier. It was evident this past year while doing a major SIEM transition at a fortune 100 that there are some changes to the landscape that are important to be aware of.
Data pipelines now shape both economics and architecture. New companies are cashing in on the market that traditional SIEM providers failed to address until they were incentivized by competition. You can filter, enrich, and route before the SIEM. You keep visibility while shrinking spend and feeding cleaner data into detections.
At the end of the day, even in 2025 the biggest focus still needs to be: Do the fundamentals well. Onboard the right logs with clear ownership and controls. Normalize to a common model. Build TTP focused detections tied to PIRs. Write tests. Tune with CTI and incidents. Track precision, recall, MTTD, MTTR, and analyst time saved.
What the Team Needs from Day One
From day one, a SOC / Security Engineering team in a large enterprise needs three things: visibility, defined process, and people clarity. Visibility means we have the right data feeds as soon as monitoring begins. You can’t detect what you can’t see. This requires early scoping of log sources and sensors: identity logs (auth events), endpoint telemetry.
Process means having an intake pipeline for new log sources (more in the next section), playbooks for detection triage and incident response, and a feedback loop to improve content. We don’t wing it; we establish how an alert flows to a case, how severity is assigned, and how handoff to incident response happens.
People clarity means everyone knows their role: e.g., detection engineers build and tune detections, tier-1 analysts triage alerts, threat intel analysts feed relevant TTPs to engineers, etc. We use a RACI model for key tasks like log onboarding and detection deployment, so it’s clear who is Responsible, Accountable, Consulted, Informed for each.
Finally, the SOC needs management support to enforce security data retention and collection from parts of the business. From day one, set the expectation that critical logs are not “optional.” If a product owner spins up a new application, they must feed its security logs to the SOC pipeline per policy. Getting that mandate early (possibly via a security standard) prevents gaps later.
Log Source Ingestion as a Process
Onboarding a log source is not an ad-hoc task, it’s a defined process with intake gates, ownership, and success criteria. New log sources should be treated like a mini-project. First, an owner for the intake (often a security engineer) and a point of contact in the source system’s team. Assign clear responsibilities: e.g., the application team is Responsible for providing sample logs and access, the security engineering team is Accountable for parsing and onboarding, privacy/legal teams are Consulted if data is sensitive, and the SOC is Informed when the source is live.
Success criteria are agreed upfront: for example, “Linux audit logs from all production servers are flowing into testnet SIEM within x weeks, parsed, and stored per retention policy Y”. Setting those criteria ensures everyone knows what “one” looks like.
Using a standard intake form for each new source should be a goal. This form captures all key details and approvals before any log is ingested. This forces conversation about data custody, retention, privacy, and legal considerations before ingestion. It’s much cheaper to address, for instance, that a log has EU personal data and needs special handling, upfront rather than after it’s already streaming.
Really spending the time to define intake gates helps avoid pain after ingestion: criteria that must be met to progress. A gate might be: “Sample logs and field schema received and reviewed”, if not, we don’t proceed. These gates act as quality control and act as a feedback loop with the team we are working with to ingest.
Crucially, as a part of this process require sample events and field lists before onboarding. This is non-negotiable. We’ve been burned by trying to ingest “unknown” data and then spending weeks wrangling it in prod.
The source team must provide a representative sample log (or we pull one from a test system) and a field description. This allows us to write or configure the parser ahead of time and map fields to the CIM. It also helps flag issues early, this could range from volume of the data, field positions and most importantly the relevance of the data itself to the SOC who is our primary customer.
You’d be surprised by the large volumes that often come in new sources that add no detection value and aren’t required for compliance!
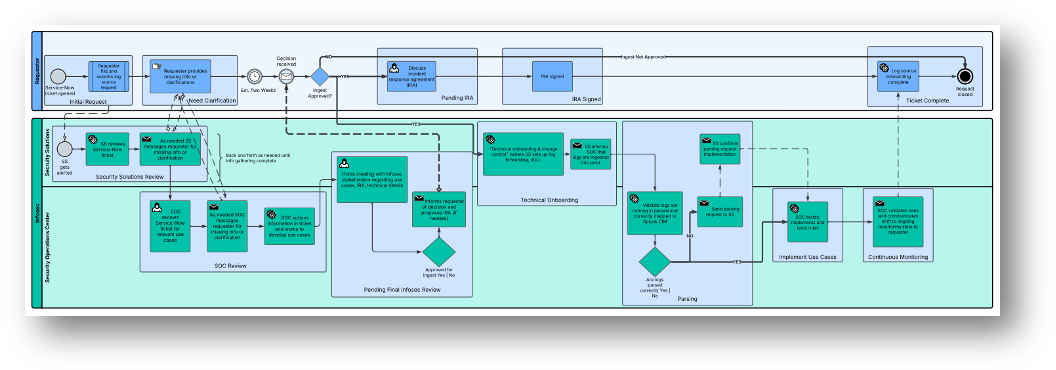
Bottom line: treat log onboarding as a formal process; it’s effectively like building an assembly line for telemetry.
Below is a depiction of a sample onboarding process for a hypothetical new log source.
Normalization, Parsing and Field Mapping to a Common Model
After ingestion, normalization is the next critical step. Why? Because if every log source uses different field names and formats, our detection rules become an unmaintainable spaghetti of source-specific logic.
Normalization enables correlation and reduces false positives by ensuring we compare apples to apples. For example, one source might call an IP address field src_ip, another might call it sourceAddress. We map both to a unified field (say source.ip) so that a single query can cover both. This consistency means a multi-source correlation rule (like an impossible travel detection combining VPN logs and Okta logs) won’t miss data due to mismatched field names or formats.
We decided on a common schema based on industry standards. Some teams use Splunk’s CIM, some use Elastic Common Schema (ECS) some may be easier to align with than others as they are baked in to you SIEM provider and others are vendor agnostic (Abstract and others allow for this agnostic approach and even tout it as a feature to avoid vendor lock in when looking at SIEM transitions).
Field Mapping Examples (Endpoint, Identity, Network)
To illustrate, here’s a simplified mapping for three high-value log sources: an endpoint EDR, an identity provider (Okta), and a network firewall. We map their raw fields to our common schema:
| Log Source | Raw Field | Mapped Field (CIM/OCSF) | Notes |
|---|---|---|---|
| EDR (Endpoint) | process_name | process.name | Name of process executed |
| parent_process | process.parent | Parent process name/ID | |
| hash | file.hash | File hash (e.g., SHA256) | |
| device_id | host.id | Unique host identifier | |
| timestamp (epoch) | event.time (UTC) | Convert epoch to UTC timestamp | |
| user (local username) | user.name | Normalize user field | |
| Identity (Okta) | actor.displayName | user.name | User performing action |
| authenticationContext.authenticationProvider | auth.provider | e.g. "Okta" | |
| outcome.result ("SUCCESS"/"FAILURE") | auth.result | Standardize to e.g. "success"/"fail" | |
| client.ipAddress | source.ip | IP of user device | |
| client.geographicalContext.country | source.geo.country | Country (for geo anomaly) | |
| eventType ("user.session.start") | event.action | Unified action descriptor | |
| Network (Firewall) | src_ip | source.ip | Source IP |
| src_port | source.port | Source Port (integer) | |
| dest_ip | destination.ip | Destination IP | |
| dest_port | destination.port | Destination Port | |
| action ("ALLOW"/"BLOCK") | network.action | Standardize network action | |
| bytes_sent | network.bytes_out | Outgoing bytes | |
| bytes_received | network.bytes_in | Incoming bytes | |
| protocol | network.protocol | Use common protocol names (TCP/UDP) |
In this table, you see we transform field names, formats, and values. For the EDR, we ensure the timestamp becomes a standard event.time in UTC (handling time zones uniformly (a must) otherwise correlations by time will be off). The EDR’s user field (maybe just a username) is mapped to user.name and if possible we’d also populate a user.id or user.email if we can resolve it, normalization can include enrichment like translating a username to a global unique ID.
In the Okta identity logs, we take nested JSON like an outcome result and map it to a simpler auth.result. We also convert values like “SUCCESS” to lowercase “success” to be consistent across sources (consistency in case and format matters for our analytics).
For the firewall, we combine fields into a category (network) and ensure terms like “ALLOW” are in a consistent format (maybe we use boolean or standard keywords).
Normalization enables correlation by creating common keys. For example, if we want to correlate an Okta login with a VPN login for the same user, both need to share a user identifier field. We ensure Okta’s user.name matches VPN’s user.name format (maybe both as email address). If needed, we add an intermediate enrichment to map one to the other (like a username alias table).
This dramatically reduces false positives: without normalization, a correlation might falsely alert because it thought two different identifiers were different users, or miss an attack because it didn’t tie related events together. With normalized fields, a rule like “user logs in from Country X and 10 minutes later same user’s endpoint triggers an admin action” is straightforward – the user.id or user.name is the same in both logs, and time is normalized to the same zone.
Normalization is not glamorous, but it’s essential. As one industry saying goes, “better to normalize data once than normalize analyst brains every time.” We prefer our analysts focus on threats, not on figuring out that src_ip and ip_src_addr are the same thing. Normalization gives them that clarity.
CTI-Driven Detection Engineering (TTPs > IoCs)
Let cyber threat intelligence (CTI) drive detection priorities. Start from what threats matter to you (based on CTI collection and your Priority Intelligence Requirements, PIRs). For example if CTI tells us that ransomware groups are actively exploiting credential theft and lateral movement via XYZ Tactic in logistics companies, we ensure we prioritize detections for those specific TTPs in our environment.
Every new detection rule we create includes several components to ensure quality and context:
- Coverage and Tags: We tag each detection with relevant ATT&CK technique IDs, kill chain stage, and any applicable data source tags. For example, a rule detecting Mimikatz usage might be tagged TA0006:CredentialAccess, T1003:LSASS Memory, source:Endpoint. This helps us ensure we have coverage across tactics and easily communicate what a rule is looking for.
- Telemetry Prerequisites: We document what data a detection needs. A rule might have a note “Prerequisite: Windows Sysmon logs with process command-lines” or “requires EDR telemetry from all workstations”. This way if a rule is not firing, we can quickly check if the data source is missing. It also helps onboarding new environments (we know which data sources to prioritize to get certain detections working).
- Logic with Test Cases: We write the detection logic and alongside it, create test cases. Test cases are specific scenarios with sample log events that should trigger the alert, and some that should not. We try to validate the rule logic with multiple test cases before deployment. It’s analogous to unit tests in software.
- Detection as Code & QA: We manage detections as code. So a new rule goes through review by another analyst / engineer. By and large we do QA in a staging SIEM environment or using historical log replay. For example, we might run the new rule over last 30 days of data in test mode to see how often it would fire (to gauge false positive levels) and if it catches any known past incidents. We also run our simulation test cases using our emulation environment to generate logs and see if our detection picks them up.
- Deployment and Tuning: Once a detection passes QA, we deploy it but often initially in a detection dev queue (depending on what is driving the need to create the detection and the overall severity). If it’s too noisy (lots of false positives), we refine conditions or add filtering (maybe exclude known safe processes or accounts).
- Change Management Loop: Detection engineering isn’t “write once, use forever.” We maintain a change log and version for each rule. When threat tactics evolve or our environment changes, we update or retire rules. For example, if we decommission an old system, rules specific to it are retired. We have a periodic review (say quarterly) where we assess each detection: is it still relevant? Did it fire usefully in the last period? If a rule hasn’t fired and the related threat is obsolete, maybe we disable it (to reduce maintenance overhead). On the flip side, if a rule is generating too many false positives, we flag it for improvement or possible deprecation if it’s not salvageable.
Throughout detection engineering, CTI drives the “what” (which TTPs to focus on) and engineering drives the “how” (writing it efficiently and accurately). We continuously pull in CTI reports, red-team findings, incident retrospectives to feed our detection backlog. For each intel piece, we ask: do we have coverage for this? If not, can we create a detection or do we need new data first?
It’s worth reiterating, we prioritize TTP-based detections over raw IoC matching. Indicator feeds of bad IPs or hashes are extremely time-sensitive and often low signal. They can be integrated as enrichment (like if an alert fires, we check if any involved IP is on a known bad list to raise priority). But as primary detections, pure IoC alerts are typically a flood of noise (looking at you American Cloud provider IP address in my intel feed shared by 5k websites).
We’d rather detect an attacker by their than by hoping we have the exact IP they used. This aligns with the Pyramid of Pain concept, targeting TTPs (top of pyramid) hurts the adversary more. It also means when attackers change commodity tools, our detections still hold.
Finally, we tie detection engineering into incident response feedback. After each major incident or notable investigation, we ask: did any detection miss this? If yes, that becomes a new detection use case to engineer. The lifecycle is continuous.
Our success metrics here: number of high-fidelity detections deployed, coverage of ATT&CK techniques and detection reliability (false positive rate, and false negatives discovered in red-team tests or incidents). Although these metrics are imperfect, over time, we aim to see more incidents caught in early stages (preventing impact) because our detections are aligned to what adversaries actually do, not just what’s easy to search.
The SIEM Paradox and the Rise of Data Pipeline Vendors
I alluded to the SIEM paradox earlier in the post: traditional SIEM vendors charge by data volume (ingest and or storage), so the more logs you send, the more you pay. Yet, to detect advanced threats, you want to send more data for more visibility. This puts security teams in a bind: either cut logs to control costs (creating blind spots) or pay exorbitantly to keep them (often with diminishing returns).
This pain point has driven the rise of security data pipeline vendors. These tools / companies (e.g. Abstract, Cribl Stream, CrowdStrike’s new CrowdStream/Onum, Splunk’s Data Manager, etc.) sit between the log sources and the SIEM, acting as a smart gatekeeper. The pipeline can filter out noise, enrich data, route logs to different destinations, and generally reduce the volume going into expensive SIEM storage. Essentially, you regain control: collect everything, but you don’t have to send everything to the SIEM at full price.
Why not just let the SIEM do it? As Forrester pointed out, SIEMs historically haven’t provided great filtering/routing tools because it’s against their financial interest. They’d rather you send all data to them. So specialized pipeline products emerged to fill that gap, and indeed, it’s become a significant market trend in the last couple of years.
Some notable moves in the market:
- The rise of Abstract: Abstract positions it’s product by sitting between sources and analytics. It ingests everything, normalizes and enriches in motion, masks sensitive fields, and routes by value. High value events go to the SIEM for real time detection; bulk telemetry lands in a lower cost data lake for search and compliance. Noise gets trimmed before index while full fidelity is kept elsewhere. You gain per source controls for schema, rate, and retention, plus the ability to fork streams to multiple tools without changing agents.
- Cribl’s prominence: Cribl Stream became a popular pipeline solution, widely adopted to reduce Splunk or Sentinel costs by parsing and filtering data in motion. So much so that major vendors now partner with it. Google Chronicle (a cloud-native SIEM) encourages using pipelines like Cribl to ingest data. Splunk’s own Data Stream Processor was in response to this need.
- CrowdStrike’s acquisition of Onum: Onum is a telemetry pipeline startup that CrowdStrike bought in 2025 for about $290M. CrowdStrike explicitly said this is to redefine the data layer of the SOC by streaming enriched telemetry and cutting SIEM storage needs. Onum can filter and enrich data, claiming up to 50% cost reduction in storage and 5x event throughput.
From a buyer perspective, how we get charged is evolving. We might end up paying pipeline vendors instead of SIEM for some portion of the data management. SIEM providers might introduce new pricing models: maybe bundled pipeline features or credits. Some offer ingest budget offsets – e.g., if you use their cloud for archive, they give you discount on hot ingest. We saw bundling: a SIEM might bundle an “all you can eat” data lake storage if you pay for a certain tier of their analytics product.
One interesting point: some SIEM vendors are adding pipeline-like features, so they don’t lose that business. Splunk added more flexible ingestion pipelines, SentinelOne is building OCSF mapping connectors, Securonix has a Data Pipeline Manager to filter before indexing. They know customers might otherwise route data elsewhere. In some cases, pipeline vendors are being acquired or integrated (CrowdStrike + Onum, etc.) to offer a one-stop platform.
At the end of the day, our stance as an enterprise SOC: the enterprise wins by using pipelines smartly. We don’t really care if we pay $1 to the SIEM or $0.25 to a pipeline and $0.75 to SIEM as long as overall cost for needed visibility is optimized. Security budgets aren’t necessarily growing in 2026 with economic fears / tariff headwinds and data pipelines tend to pay for themselves and even stretch what you’re able to ingest into the SIEM for less $ overall.
C2 Take:
Do not argue SIEM vs pipeline. Own the data layer, then choose analytics tiers that fit the use case. Cut hot ingest. Keep full‑fidelity history. Route detections where they can run fast and cheap.
Metrics That Matter
· Coverage: ATT&CK technique coverage mapped to business risks and PIRs
· Quality: Precision and recall from replay and red‑team tests
· Speed: MTTD and MTTR by use case, not just global averages
· Efficiency: Analyst time saved per rule or playbook
· Cost: Hot ingest reduced vs baseline while preserving detection outcomes
Where Abstract Fits
Abstract was built for this moment. We designed a security‑first data pipeline and analytics layer that:
· Ingests once, enriches in motion, maps to OCSF‑aligned schema, and routes by value
· Pushes high‑fidelity detections to the stream so you catch threats earlier without overpaying for hot storage
· Preserves full‑fidelity history in LakeVilla, our security data lake, so you can investigate deeply without runaway cost
· Ships ASTRO‑authored detection packs for fast coverage on high‑profile events and SaaS attack paths
· Gives your team ASE, our AI assistant persona, to speed up parsing, detection writing, and case triage with guardrails
C2 promise: We meet you where you are. Keep your SIEM, tune it, or replace it in phases. We will help you reclaim your pipeline, raise your detection quality, and lower your bill.
The Playbook: First 90 Days
1. Visibility sprint: Confirm priority sources. Pull samples. Approve schemas. Turn on staging routes.
2. Normalization sprint: Map to a common model. Enforce UTC and value standards. Add identity and asset enrichments.
3. Detection sprint: Stand up a CTI‑driven backlog. Convert top TTPs to rules with tests. Replay last 30–90 days for precision.
4. Routing and cost sprint: Move bulk telemetry to LakeVilla. Keep only high‑value events in hot tiers.
5. Readiness sprint: Document playbooks, define SLAs, and set monthly reviews. Track coverage, quality, and cost.
Ship something every week. Show a chart every week. Celebrate every noisy source that stops flooding your analysts.
Closing
Detection engineering is not a tool. It is a practice. Pipelines are not a trend. They are the control plane. If you treat both with discipline, your SOC will see more, spend less, and stop more attacks earlier.
Want help mapping this to your environment? The Abstract team can pair your engineers with ours for a short discovery and a proof of value. We will leave you with cleaner data, sharper detections, and a plan your CFO will back.
ABSTRACTED
We would love you to be a part of the journey, lets grab a coffee, have a chat, and set up a demo!
Your friends at Abstract AKA one of the most fun teams in cyber ;)
.avif)
Your submission has been received.